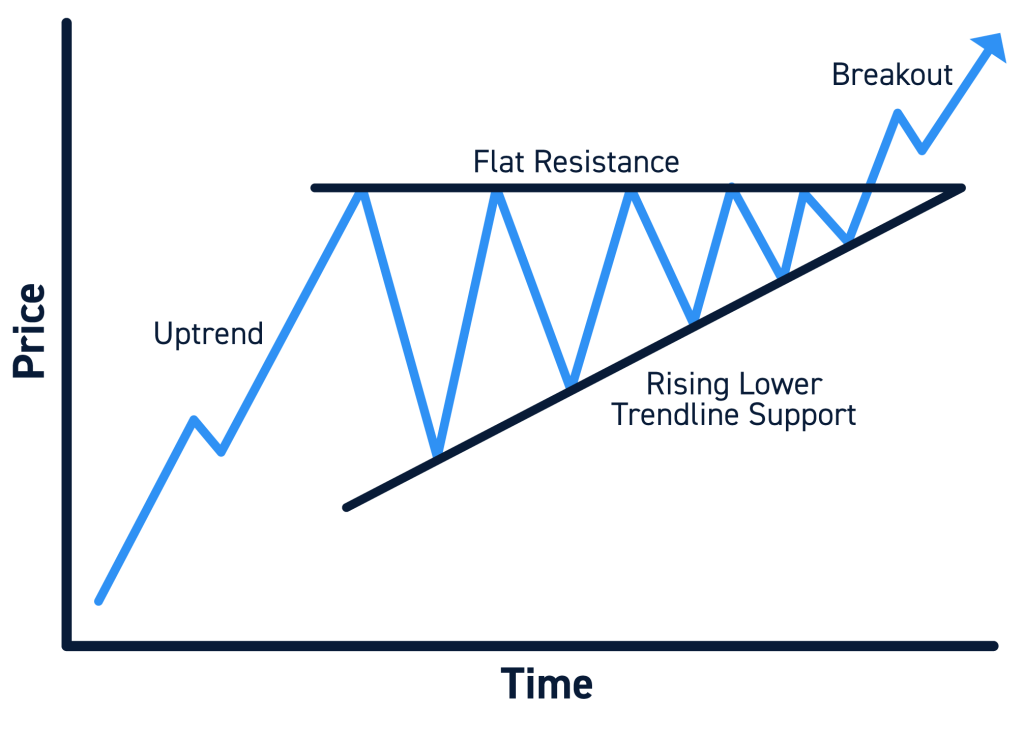
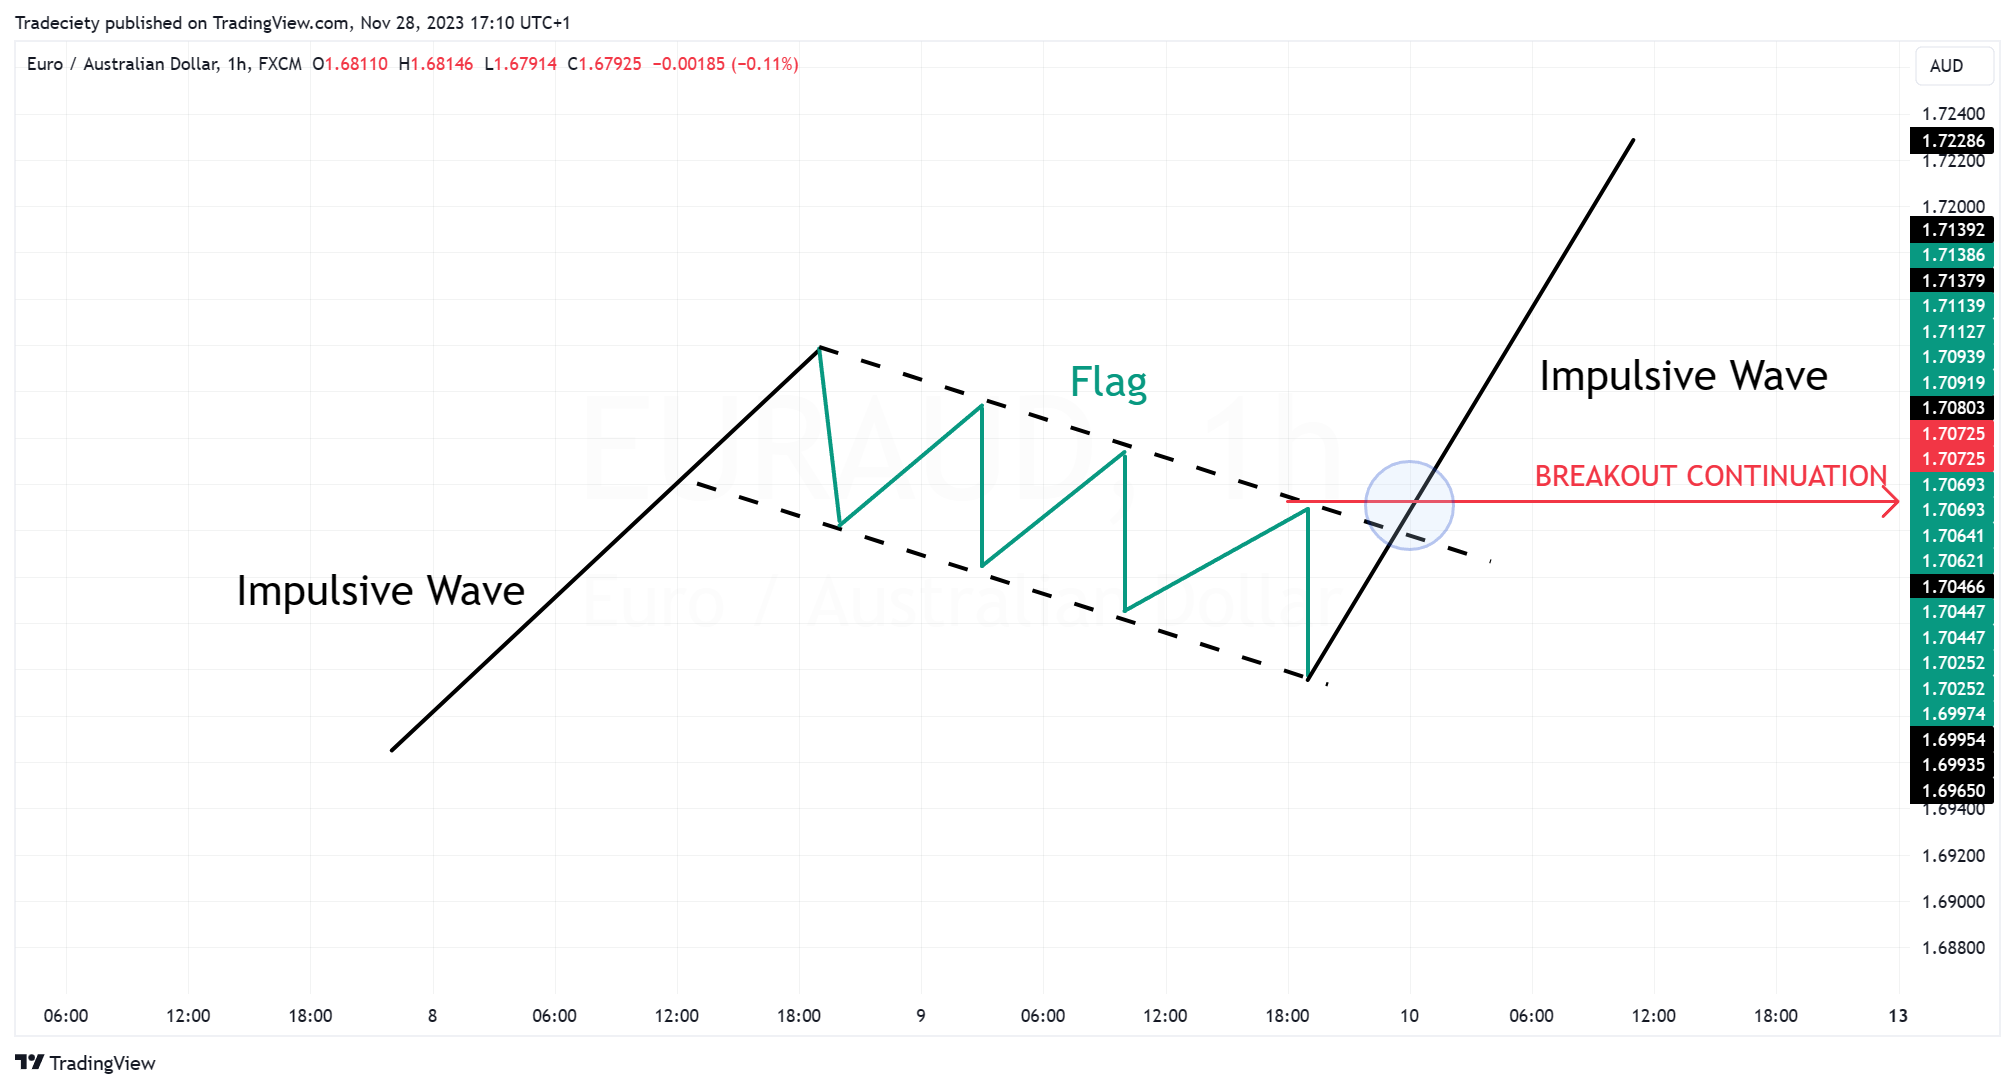
11 Chart Patterns Every Trader Should Know

What Are Chart Patterns?

Chart patterns are recurring formations in price action that signal potential future movements in the market. Traders analyze these patterns to make educated predictions about price trends.

Broadly, chart patterns fall into three types:

  • Continuation Patterns: Signal the trend will continue.
  • Reversal Patterns: Indicate a trend change.
  • Bilateral Patterns: Suggest price could move in either direction.

Top 11 Chart Patterns

staircase chart patterns


Ascending Staircase: Shows higher highs and higher lows, signaling a bullish trend.

Descending Staircase: Displays lower highs and lower lows, indicating a bearish trend.

Ascending Triangle

triangle chart patterns


Ascending Triangle: Formed by a flat resistance line and upward-sloping support, signaling bullish continuation.


Descending Triangle: Features a flat support line and downward-sloping resistance, pointing to bearish continuation.

triangle chart patterns


Symmetrical Triangle: Two converging trendlines (support and resistance) indicate potential breakout in either direction.


Flag Pattern: A sharp price move (flagpole) followed by consolidation in a rectangular shape signals continuation. (Learn more)

wedge chart patterns


Rising Wedge: A narrowing upward pattern suggests bearish reversal.

Falling Wedge: A narrowing downward pattern suggests bullish reversal.

double bottom and top Chart Patterns


Double Top: Two consecutive peaks form at a resistance level, signaling bearish reversal.

Double Bottom: Two troughs form at a support level, signaling bullish reversal.


Head and Shoulders: A three-peak pattern: one higher peak (head) flanked by two lower peaks (shoulders), signaling bearish reversal.


Rounded Top or Bottom: Gradual rounding of price signals reversal: tops indicate bearish moves, bottoms indicate bullish moves.


Cup and Handle: A rounded bottom (cup) followed by a small consolidation (handle) signals bullish continuation.

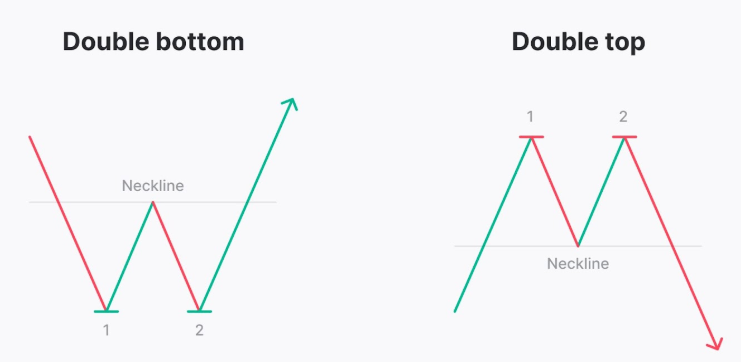
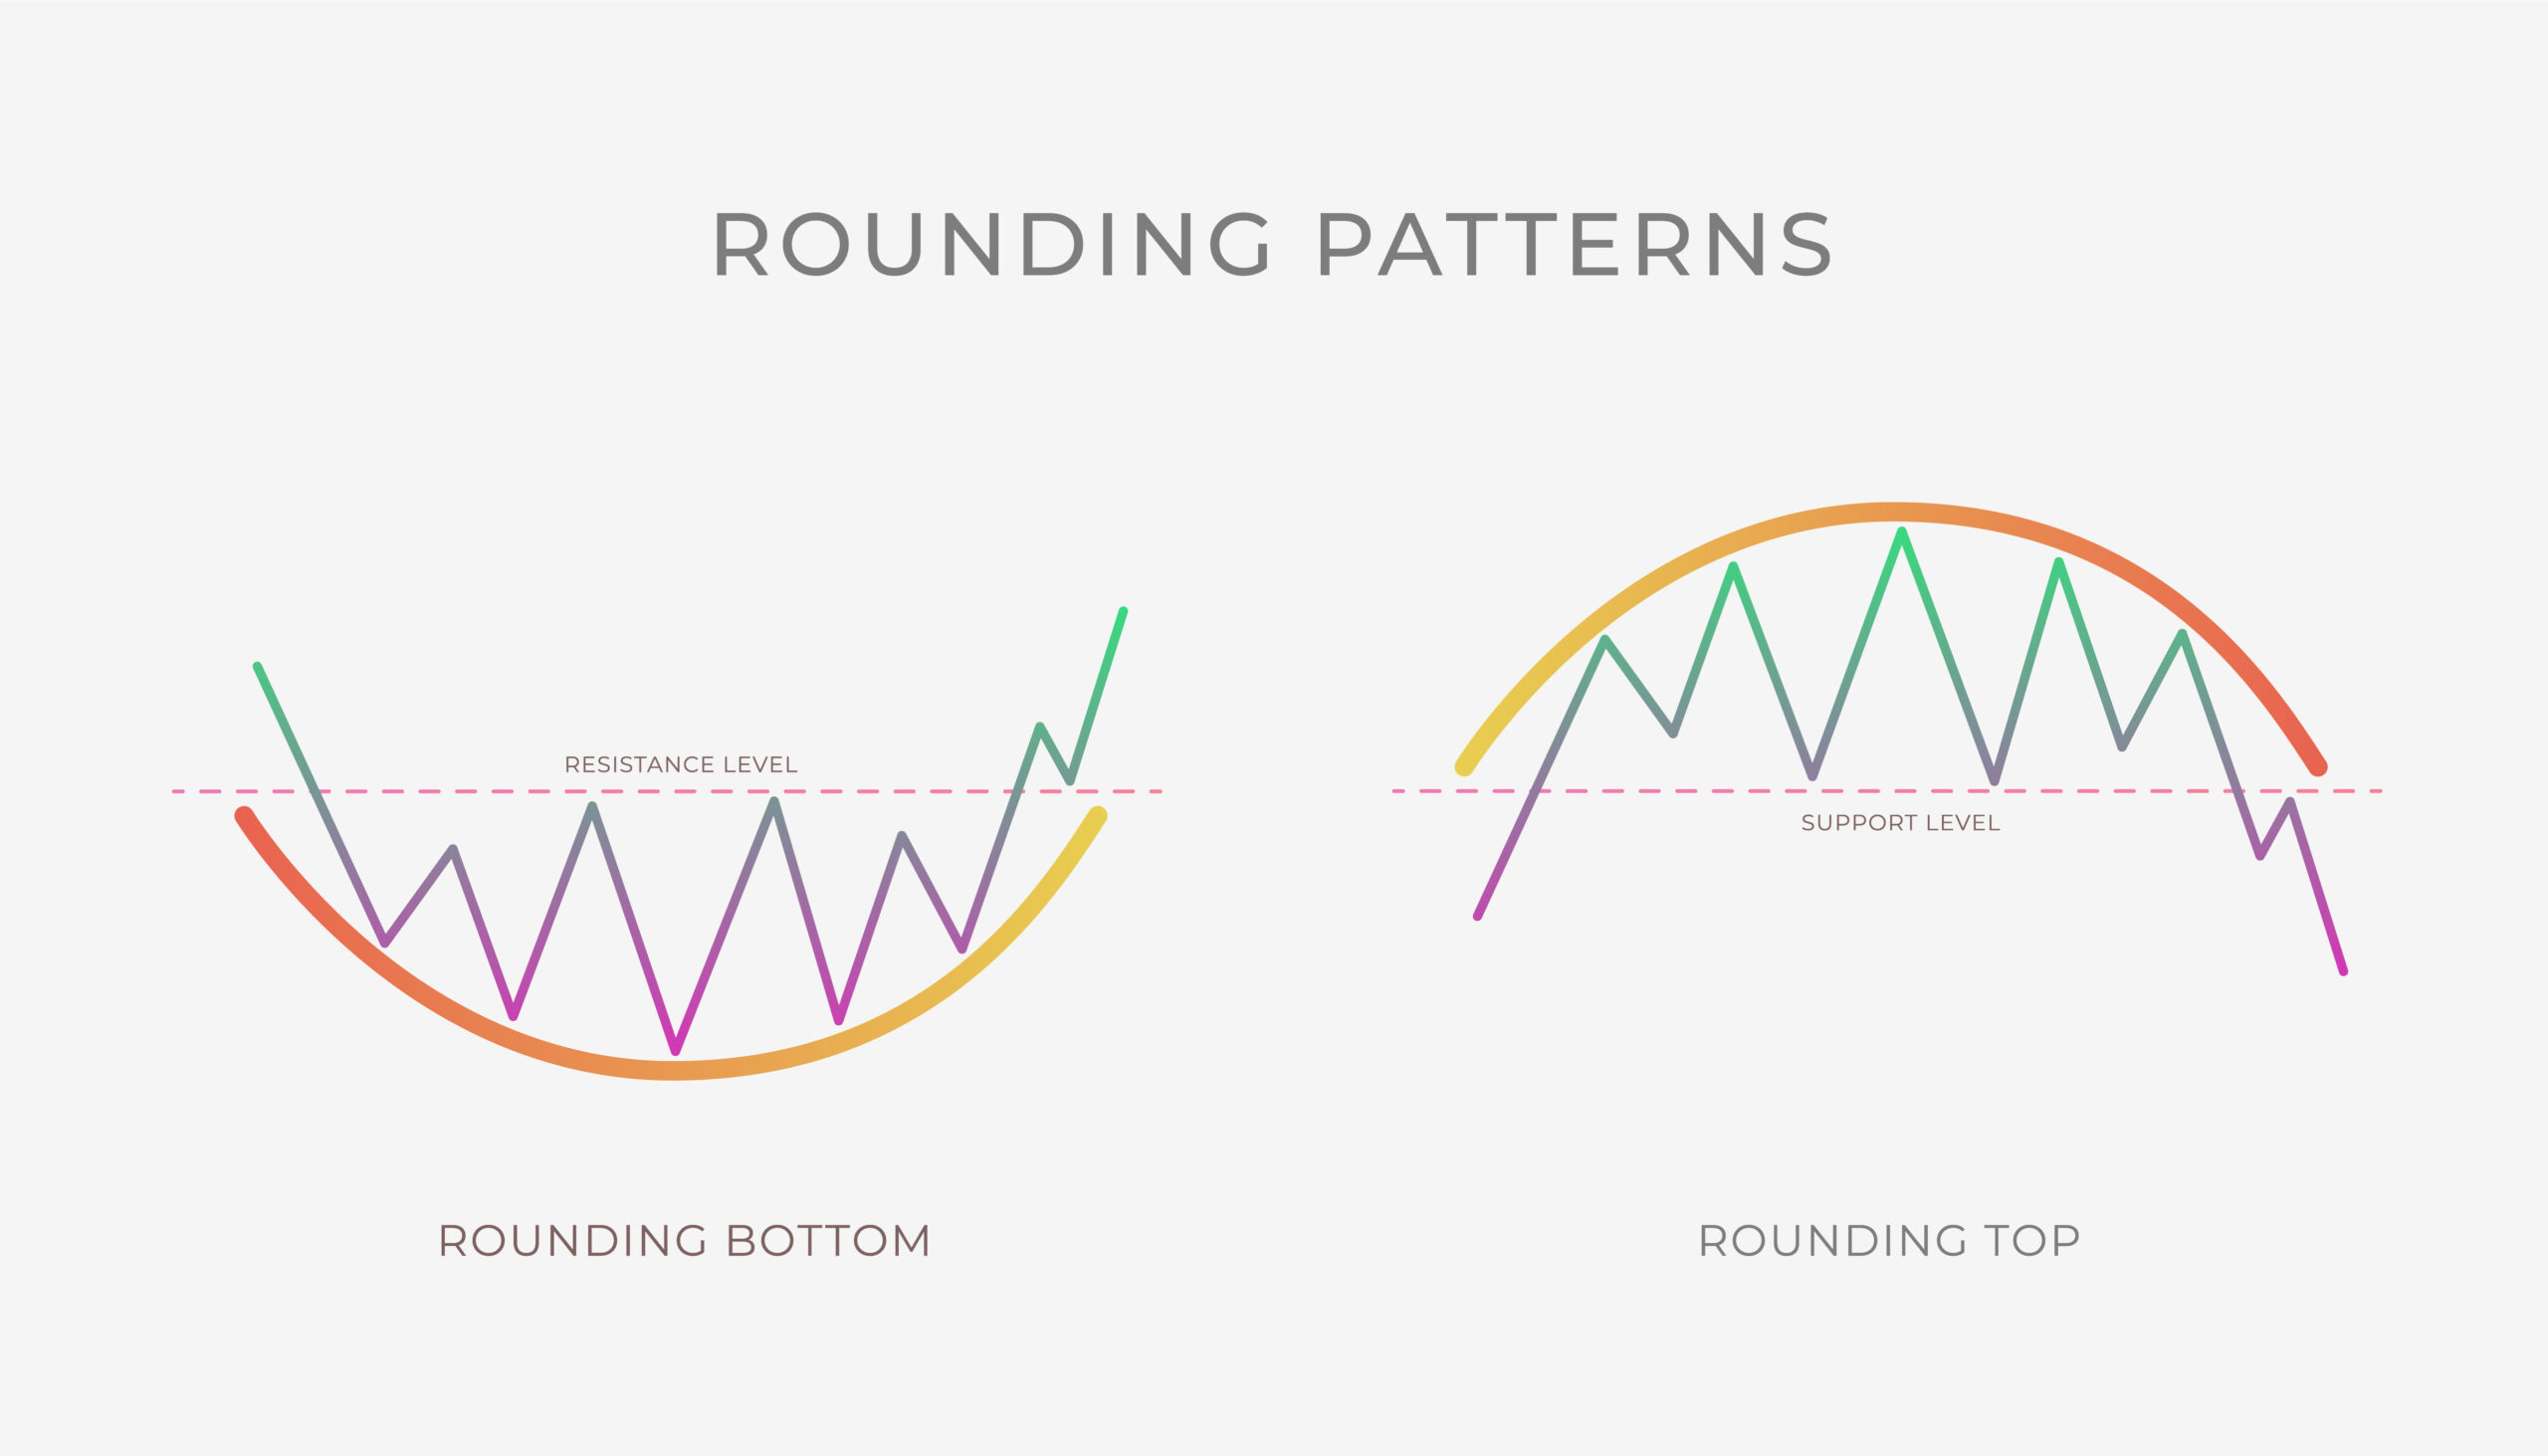
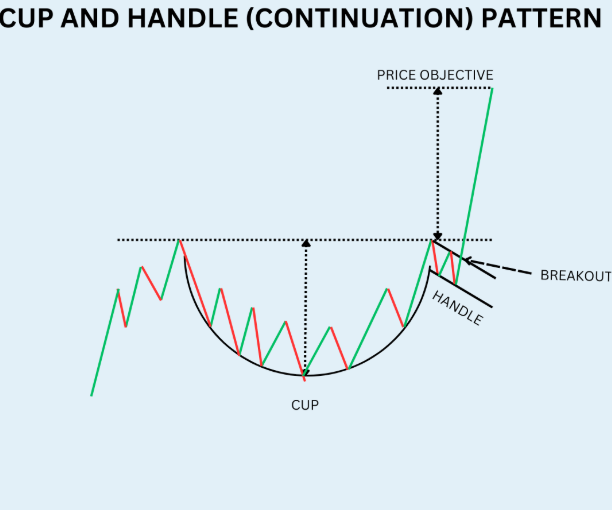
Complex chart patterns in technical analysis are more intricate formations that traders and investors use to predict potential price movements in financial markets. These patterns require a deep understanding of market behavior and typically take longer to form compared to simpler patterns. 

We will look over complex patterns in later sections of your educational journey. 

Written by,

Sigmanomics education team

more insights

Institutional vs Retail Traders

In the financial markets, participants are generally categorized as either institutional or retail traders, each with distinct characteristics and roles. We will look over institutional vs retail traders in this review.  Institutional Traders Institutional traders manage large-scale investments on behalf of organizations such as pension funds, mutual funds, insurance companies,

Read more >

Common Trading Mistakes

Trading offers both excitement and challenges. To navigate this dynamic market successfully, it’s crucial to avoid common trading mistakes that can hinder your progress. Here are six frequent mistakes traders make and how to steer clear of them: By recognizing and addressing these common mistakes, you can enhance your trading

Read more >

SEARCH

Receive the latest market news

Subscribe To Our Newsletter

Get notified about market movers