Loading...
Loading...
Barely a day goes by before financial media runs headlines like: “Today, stock prices hit a new high as investors pile into the market” or “Markets are tumbling as investors take profits”.
Following such news is often like watching stock prices move up and down. And the experience makes you wonder: Why did a particular stock jump today? Most importantly, how do traders anticipate the direction prices will take in the future?
This whole business of stock prices fluctuating and traders watching out for signals to predict future price movements may sound technical, but it really isn’t, at least to those who understand technical analysis. This concept is the subject of this article, and we will start from the very bottom
Every investing decision requires preparation. A huge chunk of the preparation process often goes to studying the potential investment to decide whether it’s worth your money. You can call this process ‘analysis’ if you want to sound sophisticated.
Investment analysis, at least the core concept, isn’t hard to grasp. Academics define it as the process of collecting information, studying it carefully, and using it to make informed investment decisions. This is the due diligence part that you do before committing money.
Analysis is a critical part of investment decisions. It opens your eyes to the asset you want to acquire, helping you answer questions like: Do I truly understand the asset I want to buy? Can I withstand the risk that comes with holding this asset?
Analysis also helps you look beyond the price tag. For example, when you look at a stock price of $50, that number alone doesn’t tell you whether the company is:
The price is just the current “vote” of all investors combined. Analysis helps you look beyond that number to understand what you’re really buying.
There are two main approaches to investment analysis: fundamental and technical analysis.
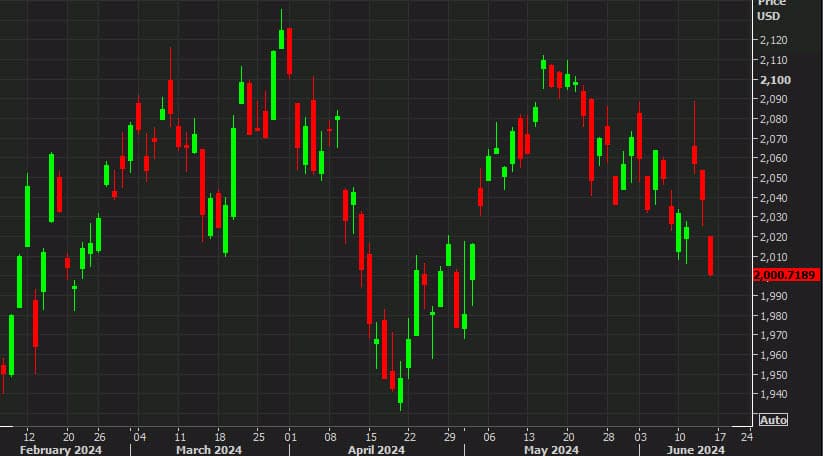
Source: Trendy Traders Academy
This analysis method allows investors to ascertain the value of a company before they buy their shares. It involves looking at things like the company’s revenue, financial position, its leadership, and even the industry in which it operates.
Other parts of this analysis approach include considering the overall economy. So, you’d consider inflation and interest rates because these can affect the company’s future.
Think of a stock as a house. In that case, if you choose fundamental analysis to prepare for purchasing the house, the process would be like:
Fundamental analysts believe that every investment has an intrinsic value. Intrinsic value is the actual worth of a company or an asset based on how well the business is performing. The opposite of inherent value is the price people are willing to pay for an asset based on what they think it should be worth.
Walk through an historic district in any city, and you’ll stumble across buildings where architects quote centuries‑old styles—arched windows, ornate cornices, cobblestone streets. Human beings recycle motifs because we’re wired for familiarity. Financial markets suffer the same nostalgia. Patterns such as head‑and‑shoulders tops, double bottoms, triangles, and flags have shown up in charts since ticker tape was a literal strip of paper.
Why the repetition? Because fear and greed never go out of style. When a price climbs, early sellers lock in profits (creating a potential ceiling), while lagging buyers kick themselves and wait for a dip (creating a potential floor). Certain formations simply capture that tug‑of‑war.
Take the 2020 pandemic crash and rebound. Many U.S. equities sketched out classic “V‑shaped” recoveries—an almost textbook bounce from capitulation to euphoria. Fast‑forward to 2022’s inflation scare, and forward again to any hot AI‑related surge in 2024–2025, and you see echoes of prior booms and busts: panics that overshoot, rebounds that over‑correct. The cast of characters changes—bankers in bowler hats have been replaced by hoodie‑wearing coders—but the script feels eerily familiar.
Study old charts the way actors study Shakespeare. The language of crowd psychology hasn’t changed; only the costumes have.
Charts give us several ways to visualize these currents:
Trendlines—the simplest sketch you can draw across higher lows in an uptrend or lower highs in a downtrend.
Moving averages—rolling snapshots of the average price that smooth out yesterday’s noise.
Momentum oscillators—RSI, Stochastic, and others that behave like speedometers, hinting when a trend is over‑revving.
The old trading cliché, “The trend is your friend,” survives because it’s uncomfortably true. Fighting a dominant trend is like stepping in front of a freight train to collect pennies. Yes, you might scalp a few copper coins, but the risk of being flattened is real.
Before you contrarian‑trade that over‑hyped tech stock just because it “feels too expensive,” ask yourself whether you’re about to pick a fistfight with a tidal wave.
Technical analysts view markets the same way. Whether it’s a blockbuster earnings report from a blue‑chip tech firm, a shockingly weak jobs number, or a tweet from a policymaker who never learned social‑media restraint, price updates in real time to reflect the collective reaction. In other words, charts are not merely pictures; they are pulse charts, recording the heartbeat of the crowd.
For the everyday trader, that’s liberating. You can step away from the firehose of press releases and economic calendars and focus instead on how buyers and sellers vote with their wallets. Of course, that doesn’t mean news is irrelevant—when the Federal Reserve turns dovish at the exact moment a stock breaks out of a long‑term range, you suddenly have two winds at your back. But the chart remains the quickest shorthand for the market’s consensus.
The next time you’re tempted to read thirty analyst notes before you click “buy,” glance at the chart first. It’s the collective résumé of every opinion that matters.
Technical analysis takes a completely different approach. Instead of focusing on intrinsic value, technical analysts focus on how the investment’s price has moved over time and how the market has behaved.
If you were to use this approach for house hunting, the process would be like:
In technical analysts’ minds, all the information about a company’s value is already reflected in its price and trading activity. That is why they focus on timing, which refers to figuring out the best moments to buy and sell based on market behavior patterns.
We know that technical analysis is antithetical to fundamental analysis. But what really is technical analysis?
The Handbook of Investment Analysis, Portfolio Management, and Financial Derivatives defines technical analysis as a method used to predict future price movements by studying past market data. The data in focus is pricing and trading volumes. This type of analysis is also thought of as the study of market action through charts and statistical indicators.
At the very least, technical analysts are forecasters. In the same way that weather forecasters study cloud formations and pressure systems to predict future conditions, technical analysts pore over charts and examine trends to pick out patterns. Nothing likens these two professions more closely than their shared goal: to use patterns to make informed predictions.
However, one doesn’t just wake up today and begin doing technical analysis. First, they must learn (and grasp) the core principles of this approach. We will do that now as well.
Technical analysis is built on three assumptions, which also double up as the core principles:
At each point in time, thousands (even millions) of traders are vying for the opportunity to buy or sell a particular stock. If this market were an auction, each trader would be throwing their offers at the stock. Now, regardless of why each trader is bidding, the final price that emerges reflects the collective judgment of all those in the room. The stock’s price captures not just the rational analysis of experts, but also the emotional reactions, the speculation, the rumors about the company’s performance, and even the fear of missing out. This scenario illustrates how market action discounts everything.
In other words, when one says that the market discounts everything, they’re simply saying that every shred of known information (rational or irrational!) is already baked into the price. So, for example, if a company announces poor earnings, the stock price immediately drops. A technical analyst wouldn’t waste time dissecting why earnings fell (that’s fundamental analysis!). Instead, they focus on what the price tells them: “The market’s sentiment just turned cold.”
This principle can be described in 11 words: “Price is the truth. Your job is to listen to it.”
An important concept in this principle is price action. Price action is the movement of a stock’s price over time. Traders assume that price action doesn’t bounce around aimlessly; it follows a discernible pattern.
In trading, prices flow in sustained directions: upward (bull trends), downward (bear trends), or sideways (ranges). Tracking these flows is the heartbeat of technical analysis.
If price action shows a pattern of higher highs (peaks) and higher lows (dips), which may appear like stairs climbing steadily, this indicates an uptrend. But the price action can also trace a pattern depicting steps retreating downwards. These lower highs and lower lows indicate a downtrend.
Prices can also churn between clear “floors” or what traders call “support” and “ceilings” (resistance), much like water sloshing in a basin. This scenario, which doesn’t produce a clear up or down movement (sideways), is referred to as a ranging (range-bound) market.
Over time, price action forms recognizable patterns. To technical analysts, these patterns are random squiggles. They’re footprints of human psychology, and humans rarely change. When greed surges, crowds buy recklessly. When fear strikes, they sell in panic. This consistency makes markets echo the past, like a crowd chanting the same anthem at every concert.
Technical analysts who study these echoes know that:
Explore More on Sigmanomics
Financial News | Stock News | Forex News | Crypto News | Education
Written by Sigmanomics Education Team

Neha Gupta is a Chartered Financial Analyst with over 18 years of experience in finance and more than 11 years as a financial writer. She’s authored for clients worldwide, including platforms like MarketWatch, TipRanks, InsiderMonkey, and Seeking Alpha. Her work is known for its technical rigor, clear communication, and compliance-awareness—evident in her success enhancing market updates.

One of the things you’ll do a lot as a trader or investor is to study price charts of the instruments that interest you. And if…

In 2025, President Trump signed executive orders imposing sweeping tariffs on imports from nearly all major trading partners. The measures set a baseline 10% tariff on…
| Symbol | Price |
|---|