Overview:
Close: 6,279.36 (+0.83%) +51.95
High: 6,284.65
Low: 6,246.46
Nearest Support: 6,100 to 6,150
Nearest Resistance: 6,400 to 6,500
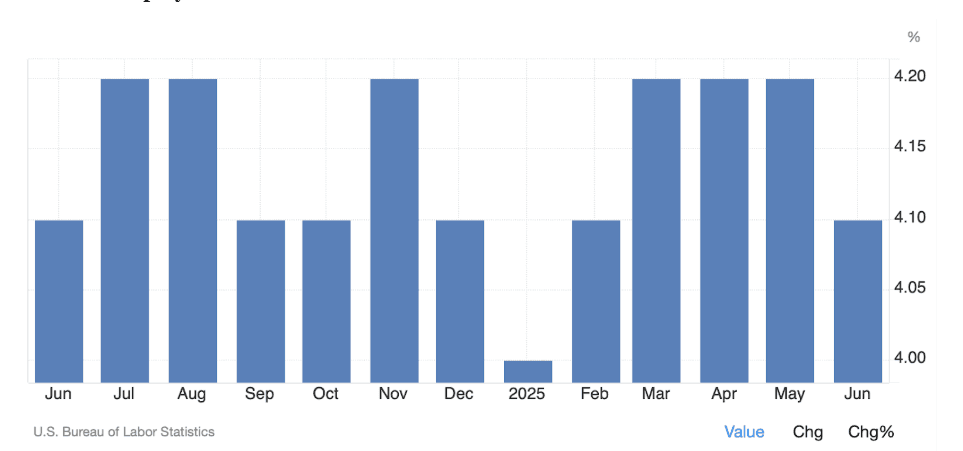
The S&P 500 has continued its bullish rally after successfully breaking through its previous key resistance level around 6,100–6,150, subsequently posting new highs in consecutive sessions. Earlier this year (as shown above), we observed how this resistance level held firm despite multiple attempts to break through it. We believe a major factor that drove this successful breakout is the growing optimism surrounding June’s unemployment data. Following the favorable unemployment announcement, the index closed strong on Thursday ahead of the July 4th Independence Day celebration.
Nevertheless, while the index has been on an uninterrupted rally, we expect a potential retracement or pullback right around the corner before it attempts to push for another high (potentially testing the 6,400–6,500 level), as it now appears to be at risk of overextension due to successive new highs. Nevertheless, we believe the prevailing bullish sentiment should help cushion the index from falling below its previous resistance, now acting as the nearest support at the 6,100 level.
Best-Case Scenario: A catalyst drives the price to break above the 6,400–6,500 resistance zone.
Base Scenario: Price consolidates within the 6,200–6,400 range in the near term.
Worst-Case Scenario: Price breaks below its newly established support at the 6,100 level.
NASDAQ 100 Index (NDX)
Overview:
Close: 22,866.97 (+0.99%) +225.08
High: 22,896.01
Low: 22,736.08
Nearest Support: 22,000 to 22,200
Nearest Resistance: 24,500 to 25,000
Similar to the S&P 500, the NASDAQ 100 Index, which tracks the largest technology companies in the US, has also been on a bullish trajectory, successfully breaking above its previous major resistance level around 22,000–22,200 and setting new all-time highs. Likewise, one of the key catalysts behind this move is the June unemployment data. In fact, the NASDAQ 100 has posted stronger gains than the S&P 500, underscoring how the technology sector remains one of the biggest beneficiaries of the recent bullish rally.
That said, we expect the index to trade between 22,300 and 24,000 in the near term, as the latest bullish catalyst is unlikely to be strong enough to push it past the next major resistance at around the 24,500–25,000 level. In fact, similar to the S&P 500, it is showing signs of overextension, and a pullback may be necessary for the index to sustain its upward move, at least until the release of the inflation data on July 18, when even a slight improvement in inflation could serve as the next potential catalyst to help the index break through the 24,500–25,000 level.
Best-Case Scenario: A catalyst pushes the price above the 24,500-25,000 resistance zone.
Base Scenario: Price consolidates within the 22,300-24,000 range in the near term.
Worst-Case Scenario: Price breaks below its newly established support at the 22,000 level.
Dow Jones Industrial Average Index (DJI)
Overview:
Close: 44,798.50 (+0.77%) 344.11
High: 44,866.50
Low: 44,438.50
Nearest Support: 42,800 to 43,000
Nearest Resistance: 44,900 to 45,000
Similar to the S&P 500 and NASDAQ 100 indexes, the Dow Jones Industrial Average (DJI) has enjoyed the prevailing bullish market sentiment. Nevertheless, unlike its counterparts, the DJI has not yet broken through its major resistance and all-time high at the 45,000 level. In fact, we observe that price last closed at 44,798.50 on Thursday, ahead of the July 4th Independence Day celebration, which is extremely close to the index’s key resistance zone.
Structurally, there is a strong likelihood that the price will struggle to break through the 45,000 level, particularly given the nearly uninterrupted bullish rally, which resembles a relatively steep parabolic move that has yet to undergo a meaningful pullback or consolidation—a condition necessary for a sustained and healthy uptrend.
Best-Case Scenario: A successful breakout above its 44,900-45,000 resistance level.
Base Scenario: Price consolidates within the 43,500–44,500 range in the near term.
Worst-Case Scenario: Price breaks below the nearest support level at 42,800-43,000.
Moreover, this unexpected improvement in the June unemployment data strengthens expectations that it will push the Fed to finally consider a potential cut in its policy interest rate to support a continued gradual decline in unemployment. Nevertheless, this remains unlikely due to the inflationary fiscal policies currently in place, which the Fed worries could worsen inflation (which currently stands at 2.4%, above its 2% target).