Sigmanomics Market Recap and Forecast, Week of August 25 – 31, 2025
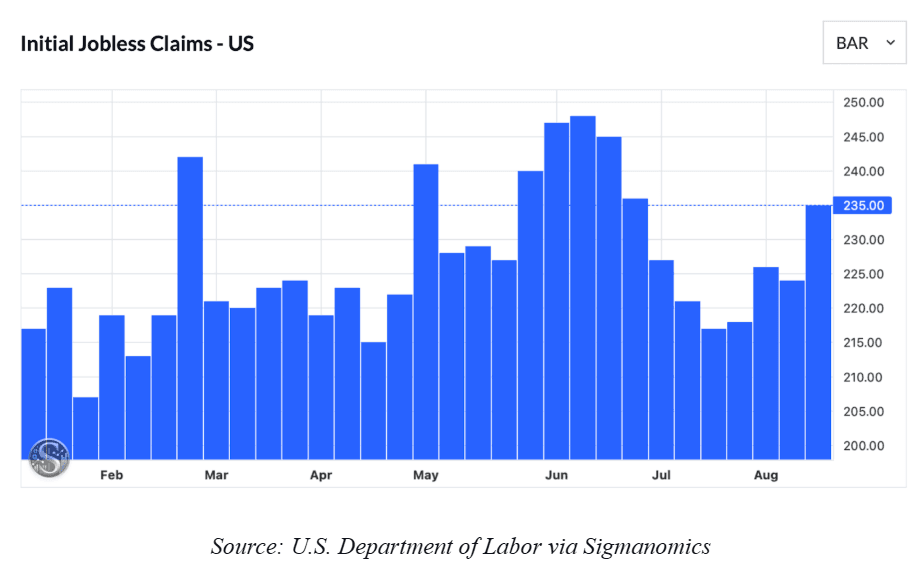

On Thursday, August 21, the initial jobless claims increased by 11,000 to 235,000. This is well above the market consensus of 225,000 and is currently the biggest one-week increase in the past 2 months. As a result, the US financial markets reacted net negatively to the news, as the data signaled that the job market is starting to weaken and overall hiring is slowing down. This negative sentiment was further fueled by fears that it could be an indirect effect of the renewed sweeping tariffs the White House announced.
 Source: Sigmanomics
Overview:
Close: 6,466.92 (+1.52%; +96.74)
High: 6,478.89
Low: 6,384.59
Key Support Zone: 6,200 to 6,250
Key Resistance Zone: 6,500 to 6,600
Since the start of the month of August (when it broke below its ascending channel), the S&P 500 Index (SPX) has been moving below its previous channel. As a matter of fact, the upward channel’s lower boundary has served as a key resistance level (as shown in the illustration above). Hence, for the index to move decisively bullish, it needs to break past its previous all-time high and move back into this channel in the near term.
Otherwise, if it fails to do so, then it is likely a signal of a shift in the general trend direction towards a consolidation/sideways movement in the near term. Yes, this is despite Wall Street’s initial optimism (reflected in the most recent long-bodied bullish candle) about a potential cut in the Fed’s policy interest rate in September. Note that while Powell hinted at a potential rate change, he did not decisively favor a cut. In fact, due to the mixed economic results (and fiscal uncertainties) in the recent months, the Fed may well be swayed toward a rate increase instead.
Market Outlook:
Best-Case Scenario: SPX breaks the 6,600 level (setting a new all-time high) and moves inside the previous upward channel.
Base Scenario: SPX moves between 6,300 and 6,600 in the near term.
Worst-Case Scenario: SPX breaks below its key structural support zone (6,200 to 6,250).
 Source: Sigmanomics.com
Overview:
Close: 45,631.74 (+1.89%; +846.24)
High: 45,757.84
Low: 44,952.88
Key Support Zone: 44,000 to 44,300
Key Resistance Zone: ~46,000 (next key level)
In contrast with the S&P 500 and NASDAQ 100, the Dow Jones Industrial Average Index (DJI) has successfully held inside the upward channel, despite also suffering a similar significant drop early this month. Notably, when it did drop, it just hovered around the channel’s lower boundary and did not decisively break below it. Hence, when sentiments lighten up in the following two weeks, it smoothly moves back comfortably within the channel’s range. Due to this, in the near term, we expect the price to continue moving within this range unless a new catalyst emerges.
Market Outlook:
Best-Case Scenario: DJI breaks above the upper range of the current upward channel.
Base Scenario: DJI continues to move inside the upward channel.
Worst-Case Scenario: DJI breaks below its key structural support zone (44,000 to 44,300).
To learn more about these major indices, as well as how the stock market works and the basics of technical analysis, we recommend checking our free and beginner-friendly educational resources at https:/www.sigmanomics.com/education
Dave Calutan, MBA
With 10 years of extensive investing and trading experience across Global Financial Markets, including US and International Stocks, Indices, ETFs, Forex, Cryptocurrency, Derivatives (Options & Futures), and Commodities (e.g., Gold & Oil). As a testament to Dave's investment expertise, he has won the National Stock Trading Competition '18.